Common Mistakes in PVsyst Simulations and How Drawings Correct Them
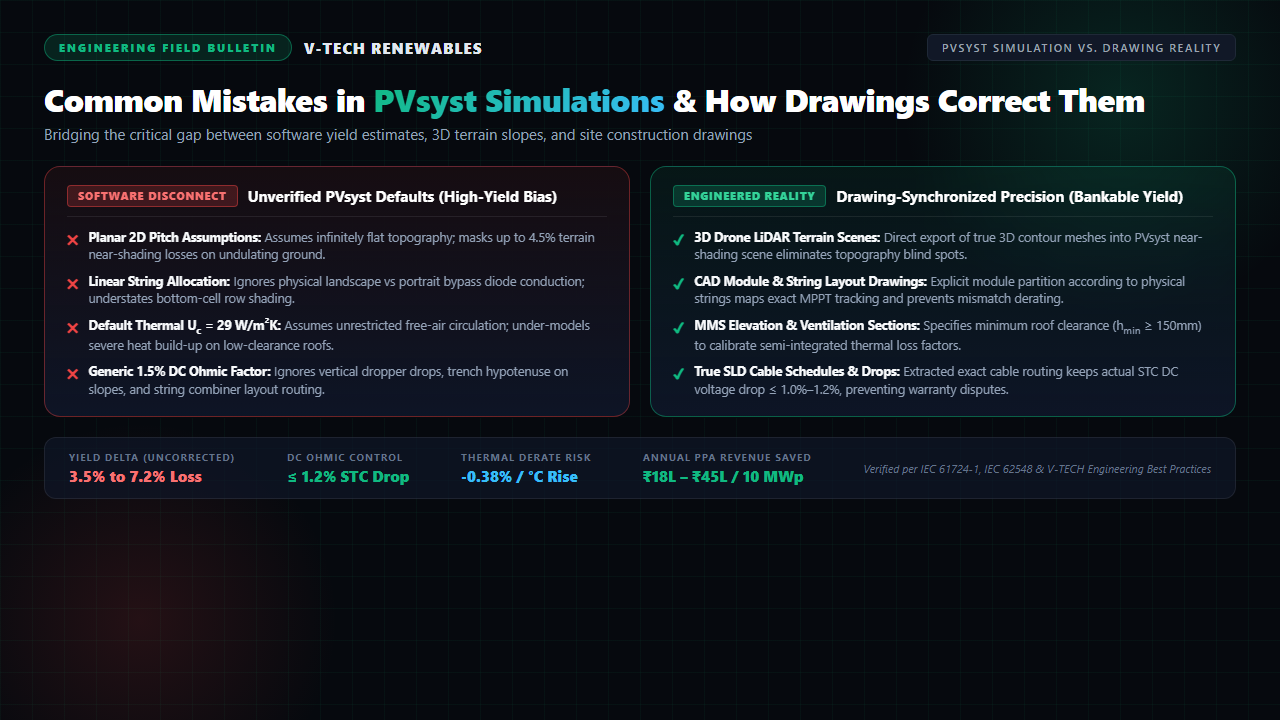
A 10 MWp solar project commissioned in Maharashtra fell 5.4% short of its contracted Performance Ratio (PR) during the initial year of commercial operation. The investor faced ₹32 Lakhs in energy shortfall penalties under their Power Purchase Agreement (PPA). During the forensic technical audit, the simulation report revealed an idealized P50 yield calculation based on software default constants completely disconnected from the on-site electrical single-line diagrams (SLDs) and structural shop drawings.
In competitive solar EPC execution, PVsyst is the global benchmark for bankable energy generation modeling. However, a simulation is only as reliable as its physical inputs. When modeling engineers accept default coefficients without synchronizing with detailed solar power plant design drawings, software forecasts produce optimistic generation figures that vanish once metal meets the ground.
Why Simulation Yield Models Drift from Field Reality
PVsyst relies on mathematical algorithms that require explicit physical definitions. When project schedules tighten, modeling engineers frequently treat secondary loss tabs as formality checkboxes, leaving default assumptions untouched:
- Planar Topography: Treating undulating ground as a smooth horizontal plane.
- Abstract Stringing: Assuming uniform, linear shade dissipation without tracing physical module orientation.
- Free-Air Convection: Applying ground-mount thermal cooling factors to flush-mounted industrial rooftops.
- Generic DC Cabling: Entering an unverified 1.5% ohmic drop placeholder while actual cable runs stretch across long trench drops.
Bridging this gap requires strict cross-functional discipline: every loss parameter entered in PVsyst must reference an approved engineering drawing, cable schedule, or topographic survey mesh.
The 4 High-Risk PVsyst Simulation Mistakes (and How Drawings Correct Them)
1. The Flat-Earth 2D Pitch Fallacy (Near-Shading & Topography)
The most frequent error in early-stage engineering is modeling inter-row pitch on an infinite, planar 2D plane. On ground-mount sites across western and central India, terrain frequently rolls with natural gradients of 2 to 6 degrees.
When arrays step downward on north-facing micro-slopes, the preceding southern row casts an elongated shadow that the 2D pitch calculation ignores. During early morning and late afternoon hours (solar zenith angles > 65°), unpredicted shadow fall strikes bottom module rows, causing up to 4.5% in unmodeled near-shading losses.
The Drawing Fix: As highlighted in our analysis of 3D modeling vs. 2D layouts, engineers must import true 3D Digital Terrain Models (DTM) derived from drone LiDAR surveys directly into the PVsyst 3D shading scene. Array layout drawings must define table breaks, varied post reveals, and stepped ground clearances to replicate site contours accurately.
2. Linear String Shading vs. Bypass Diode Conduction (Module Layout)
In the "Detailed Losses > Ohmic Losses" and "Near Shading" tabs, PVsyst offers an option for "Fraction for electrical effect" or module layout partitioning. Leaving this set to simple linear shading assumes power drops in direct proportion to shaded area (e.g., 5% shaded area equals 5% power loss).
In physical reality, silicon photovoltaic cells operate in series within a string. When modern half-cut mono-PERC or TOPCon modules are mounted in portrait orientation, horizontal inter-row shadow strikes the bottom row of half-cells. This forward-biases the bypass diodes, knocking out an entire module sub-circuit or shutting down current across the entire string. If multiple strings are paralleled on a single MPPT tracker, the voltage mismatch forces the inverter to throttle healthy strings.
The Drawing Fix: The modeling team must import the structural module layout drawing into PVsyst's "Module Layout" tool. Grouping strings horizontally and matching them to dedicated inverter MPPT channels on the electrical layout ensures shadow impact remains isolated to the lowest physical table tier.
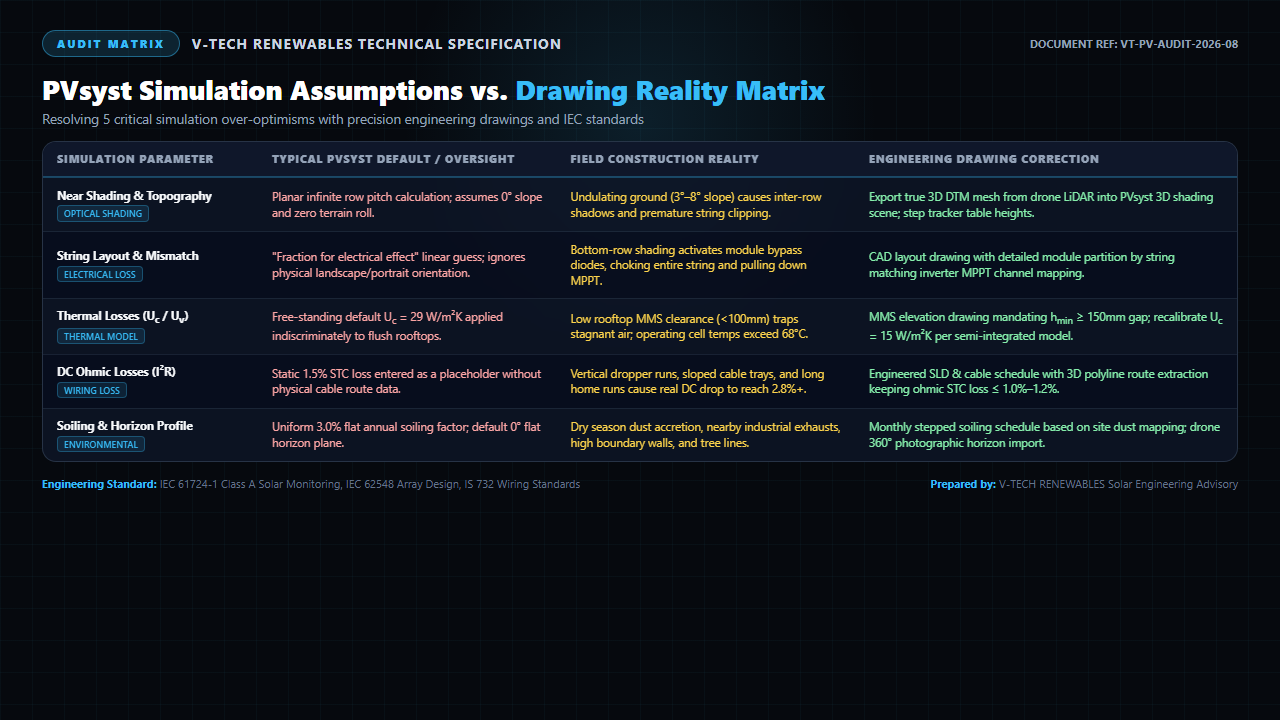
Figure 1: Engineering audit matrix detailing 5 core PVsyst simulation defaults, field construction oversights, and synchronized drawing corrections.
3. The Free-Standing Thermal Loss Fiction (Uc and Uv Factors)
Photovoltaic cell efficiency drops significantly as operational temperature climbs, typically by -0.35% to -0.38% per °C above 25°C STC. PVsyst calculates cell temperature using the Faiman thermal balance equation:
Here, Uc represents constant heat transfer (W/m²K) and Uv accounts for wind-induced cooling. PVsyst defaults to Uc = 29 W/m²K and Uv = 0 for "free-standing" arrays with unrestricted back ventilation.
Applying Uc = 29 W/m²K to Commercial and Industrial (C&I) rooftop installations mounted flush to metal trapezoidal sheets or low-clearance RCC pedestals is an expensive mistake. When the clearance gap beneath modules is less than 100mm, hot air becomes trapped beneath the array. Cell temperatures regularly reach 68°C to 72°C during midday peak generation, triggering an extra 2.0% to 3.5% thermal derating that uncalibrated simulation files miss.
The Drawing Fix: Structural shop drawings must specify module mounting structure (MMS) cross-sections with a minimum ground/roof clearance (hmin ≥ 150mm to 200mm) to promote convective air movement. For semi-integrated and low-slope rooftop arrays, the simulation engineer must adjust Uc down to 15–18 W/m²K to reflect restricted ventilation.
4. The Static 1.5% DC Ohmic Placeholder (Cable Schedules)
Most preliminary PVsyst reports adopt an arbitrary 1.5% DC wiring loss at STC. In actual solar EPC installations, DC wiring encompasses string cables (4mm² / 6mm² solar copper), main DC home-runs (aluminium armored 1C × 120/185/240mm²), combiner box busbars, and disconnect switches.
Planar drafting measurements ignore vertical dropper drops into cable trenches, looping allowances at string combiner boxes, and topographic elevation changes. If field runs stretch without upsized conductors, actual operating DC resistance losses climb to 2.4%–3.0%, generating excess heat and accelerating cable insulation aging per IS 732 and IEC 62548.
The Drawing Fix: As detailed in our guide on preventing solar CAD re-work, engineering teams must extract true 3D route polylines into an automated cable schedule. Cable sizing calculations must enforce a maximum voltage drop of ≤ 1.0% to 1.2% at peak STC operating current before finalizing the simulation parameters.
PVsyst Assumptions vs. Engineering Drawing Reality Matrix
To eliminate revenue shortfalls and secure bankable asset financing, engineering teams must calibrate each simulation loss factor against physical shop drawings:
| Simulation Parameter | Typical PVsyst Default / Error | Real-World Field Disconnect | Engineering Drawing Fix & Standard | PR / Yield Impact |
|---|---|---|---|---|
| Near-Shading & Pitch | Planar 2D infinite row calculation; 0° horizontal terrain assumption | Undulating ground (2°–6° slope) induces early inter-row shadows | Import 3D LiDAR terrain mesh; step table heights per civil grading plans | +2.5% to +4.5% accurate yield modeling |
| String Layout & Mismatch | Linear shade fraction guess; ignores cell bypass diode circuits | Bottom-cell shade activates bypass diodes, collapsing string voltage | CAD module partition drawings matching physical strings to MPPT channels (IEC 62548) | Recovers 1.8% to 3.2% electrical mismatch |
| Thermal Model (Uc / Uv) | Uc = 29 W/m²K default applied indiscriminately to rooftops | Tight roof clearance (<100mm) traps hot air; operating cells reach 70°C+ | MMS elevation drawings mandating hmin ≥ 150mm; set Uc = 15 W/m²K | Prevents 2.0% to 3.5% unbudgeted heat loss |
| DC Ohmic Loss (I²R) | Static 1.5% entered without reference to route length or conductor area | Trench droppers and sloped tray runs push actual DC drop past 2.8% | Derived from 3D polyline cable schedule; sized for ≤ 1.0%–1.2% STC drop (IS 732) | Conserves 0.8% to 1.5% net delivered energy |
| Horizon & Far Shading | 0° flat artificial horizon; generic 3.0% flat annual soiling | Boundary treelines, transmission pylons, and post-monsoon dry season dust | 360° drone sun-path horizon import; seasonal stepped soiling schedules | Prevents severe seasonal CUF penalties |
Engineering Protocols: Bridging the Model-to-Drawing Gap
Solar developers and EPC contractors can protect their balance sheets by adopting a closed-loop engineering protocol across every project phase:
First, establish that no PVsyst energy generation report is labeled "Bankable" or "Final" until layout drawings reach Approved for Construction (AFC) status. Preliminary simulations used for land acquisition must explicitly carry P50 conservative derating bands to account for unmapped terrain relief.
Second, require drawing-verified parameters for all primary loss factors. Demand that the electrical engineering team submits an accompanying loss verification sheet showing how cable schedule cross-sections calculate back to the exact ohmic percentage entered into PVsyst. Align this with the rigorous protection standards detailed in our guide on SLD best practices for C&I solar.
Third, review our master engineering methodology in the complete PVsyst simulation guide. Combining validated 3D software models with precision structural shop drawings ensures asset owners receive the full energy yield promised on paper throughout the 25-year operational lifecycle.
Frequently Asked Questions
1. Why does actual solar plant performance often fall 3% to 6% below PVsyst P50 yield estimates?
The shortfall occurs because simulation engineers frequently rely on software default parameters: flat 2D ground planes, uniform linear string shading, free-standing thermal coefficients on tight roofs, and generic 1.5% DC wiring losses. When construction drawings reveal sloped ground, bottom-cell bypass diode choking, restricted roof convective airflow, and long trench routes, actual field losses compound quickly.
2. How do module layout drawings prevent electrical mismatch losses caused by bottom-row shading?
When modules are mounted in portrait orientation, diffuse early-morning inter-row shading strikes the bottom cells, activating all bypass diodes and collapsing string voltage across the entire row. By consulting module layout drawings upfront, engineers configure strings horizontally or assign bottom module rows to dedicated inverter MPPT channels, isolating shade impact.
3. Why is applying default PVsyst thermal loss factors (Uc = 29 W/m²K) dangerous for rooftop solar?
PVsyst defaults Uc = 29 W/m²K for free-standing arrays with unlimited rear ventilation. Rooftop installations mounted close to tin sheets or RCC slabs (clearances <100mm) experience severe thermal trapping where cells reach 68°C to 72°C. Calibrating Uc to 15 W/m²K with zero wind factor (Uv = 0) accurately captures heat derating and prevents inflated P50 revenue forecasts.
About the Author
Written by the Engineering Team at V-TECH RENEWABLES, Pune—specializing in bankable PVsyst energy yield simulations, drone LiDAR terrain modeling, and IFC electrical drawing packages across 500+ MWp of solar installations throughout India.